Section 05: Analysing the data
Once the MEL data has been gathered it can then be analysed and turned into evidence about progress and impact that can be reported, shared and used for both accountability and learning purposes.
The process below demonstrates that good data analysis requires a methodical approach with several very clear steps.
Each step needs to reflect the nature of the data collected.
5.1 Create a raw data bank
To record all the different sources of data. This might include completed questionnaires, items of literature, notes from focus group discussions and interviews, media cuttings, observations from field work, notes from team meetings or meetings with stakeholders, and visuals.
5.2: Logging data
Each piece of information should be catalogued using a numbering and coding system. Use a table to keep a record of all surveys, interviews, meetings or focus groups. Make sure there is a record of when meetings or interviews took place, who was invited, who attended, who facilitated and who took notes. For documents, use a referencing system or electronic library to keep track of the sources, what they relate to, and where to find them. Any films or recordings should be downloaded and carefully catalogued including details such as respondent name(s), date, time and place.
5.3: Transcription and translation
The rough notes from interviews, focus groups and fieldwork need to be typed up; and transcribed and translated if necessary. The value of writing up everything is that data are then easier to handle, understand, copy and store. However, transcription and translation is resource-intensive (time and cost). Note that when writing up focus groups, observations about who said what, and how people of different gender and identity groups behaved and interacted should be included.
5.4: Storing data
You will need a clear system for storing the data in paper or electronic formats, and that responsibility for the raw data is assigned. Raw data may be required for further analysis at a later date, or for verifying claims. Having a clear system is particularly important if the people who were responsible for collecting the data leave an organisation or change roles. Sensitive data, including personal information on interviewees, should be password-protected or encrypted. Make sure all electronic data is backed up.
5.5: Sorting data
The first thing you need to do is to get to know the data by reading (over and over again if necessary) and breaking it down into different components. There are different ways that data can be broken down:
By type: quantitative (numerical information, responses to closed questions, pre-coded data), qualitative (words, statements, responses to open questions, narratives and stories from interviews), content (literature and other documents and texts).
By theme or area of interest, for example around evaluation questions, key lines of enquiry or indicators.
By respondent groups.
5.6: Processing the data (level 1)
Quantitative data: The analysis of quantitative data permits the ability to generate a broad picture around the research questions, to establish some basic patterns using percentages, averages and measures of spread. It also allows you to spot trends and interesting points for deeper analysis and outliers or unexpected findings. To draw some associations between different variables, e.g. X% of men of a certain age said Y about women participating in public life and to create visual representations of the data in the form of charts, graphs and figures.
Qualitative data: Qualitative data requires sense to be made of (often) a large volume of texts. These could be short responses to open questions in a survey, but each statement will be different because the respondent has used their own words. Or they might be transcripts from a two-hour focus group or interview. The analysis of qualitative data permits the following:
To interpret the meanings of statements from respondents
To draw out themes from multiple responses to open-ended questions
To establish patterns across different types of texts
To draw out statistical data from qualitative data, i.e. establish the percentage of people who mentioned a particular issue in response to an open-ended question
To identify and explore single anecdotes that are worthy of further interrogation
To identify stories that can provide rich depth to your reports or other outputs
5.7: Interpreting the data (level 2)
Evidence is generated by interpreting the patterns and trends in the data. This is done by putting the different bits of data back together again in order to make and substantiate claims. Essentially this step is about working out what it all means.
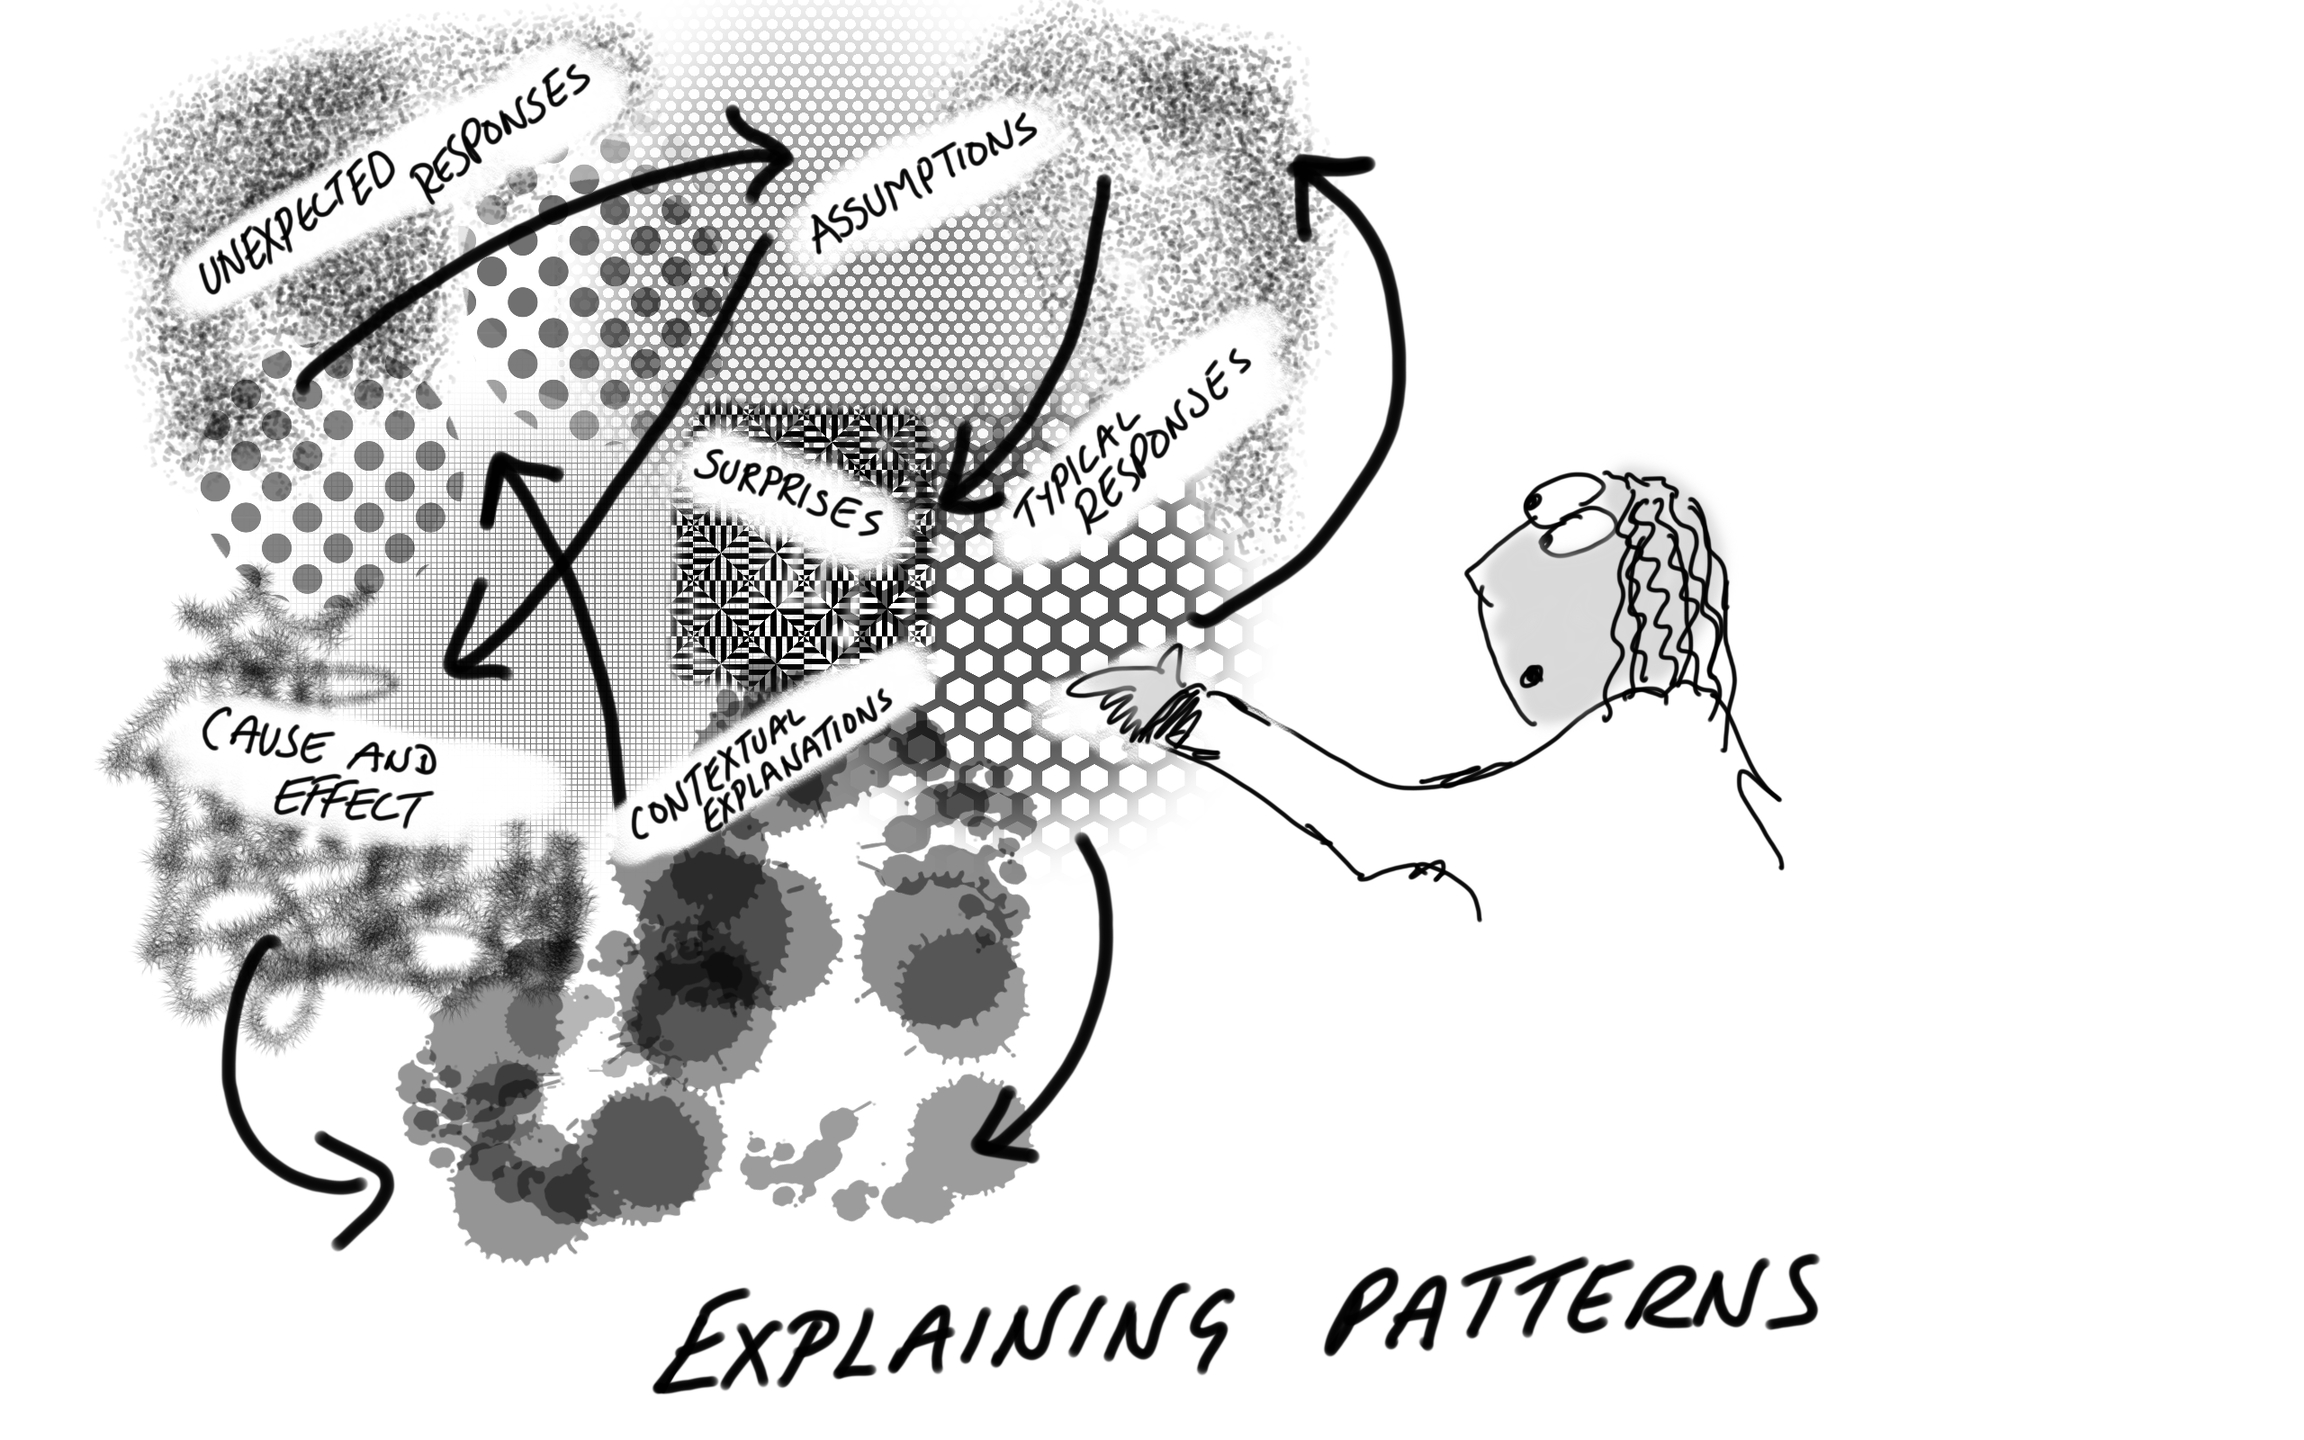
Explaining patterns: start by identifying patterns, associations and relationships between different clusters of data. What is the range of responses to key questions, e.g. how many people agreed or disagreed? What were the typical responses, i.e. those that came up most frequently? How strongly did respondents feel about the topic? Is there anything surprising or unexpected that challenges assumptions? What are the underlying, contextual explanations for the patterns? Can any cause and effect be identified? This can be approached from two different directions:
Starting with the key lines of enquiry/questions/indicators: what is the relevant question or indicator that these data relate to? What is the answer that they provide? Do the data confirm expectations or are they saying something completely different?
Starting with the data: What do the data seem to be saying, and does that answer any of the questions? This approach is less structured and allows the data to tell the story, which may be a different story to the one anticipated.
Triangulation: this involves putting together different pieces of evidence to justify claims about an issue or question, using different sources to show similar ideas, concerns and opinions. Pieces of data which contradict other pieces need to be handled with care. This might involve deeper exploration to tease out the contradictions, or it may just require a clear note/explanation in the report for future reference and study.
5.8: Internal Validation
This is a reflection step. It is a moment for stepping back and challenging the evidence drawn out of the data, the assumptions being made and the learning. It is also an opportunity to share preliminary findings and reflections with others and to get their feedback, as well as to draw out lessons for future reference.
Internal validation: spaces should be created for reflection amongst those collecting and analysing the data. It is particularly important to reflect on the quality of the data, including issues such as: researcher influence over the process; how data are being interpreted; contextual factors that might have affected the data but have not been taken into account; ensuring that generalisations are not being made that are not justified; and ensuring that alternative explanations are considered for the findings.
Thinking through the quality of the evidence is a part of preparing to write up the findings, and a way of preparing to respond to any criticisms of the data and claims.
The most straightforward way to deal with any anomalies in the data or evidence is to provide a very clear explanation of the methods used, the choices made, and how those choices may have affected the results. However, the raw data may need to be revisited or additional data may need to be collected to fill in gaps. In some instances, the data may just not be useable.
5.9: External Validation
External validation: the main challenges and criticisms of data and evidence are that they are not considered to be independent, credible, valid or objective. This is where keeping a very clear record of choices and actions throughout the M&E process or exercise becomes extremely important, providing a justification of what was done and how. It is therefore also good practice to build in an external validation process to:
Share initial findings, key learning and ideas for action with other key stakeholders and get their feedback. This is an opportunity to check the accuracy of the findings, to test them and to check how they are being portrayed. This process is also about ensuring that stakeholders are involved in the analysis and can share in the learning process. This can be done through validation meetings or workshops, and through reporting initial findings in written forms.
Take on board comments and ideas. Consider how to deal with any criticisms about the methods, problems with the findings, or gaps in the data. And finally document this process.
Learning does not just happen. In order to nurture learning in an organisation we need to provide staff with:
Last updated